Whitebook CIRRUS – Remote Sensing
A HALO mission to investigate water vapour and cirrus clouds in the lowermost stratosphere (LMS)
Contents
Scientific background
Importance of the UTLS region for climate change
The upper troposphere / lower stratosphere (UTLS) region plays a key role in the climate system. Changes in the structure and chemical composition of this region result in particularly large changes of the radiative forcing of the atmosphere, which trigger climate change. This is illustrated in Figure 1 by means of the sensitivity of surface temperature to mass changes of important greenhouse gases (ozone, water vapor, methane).
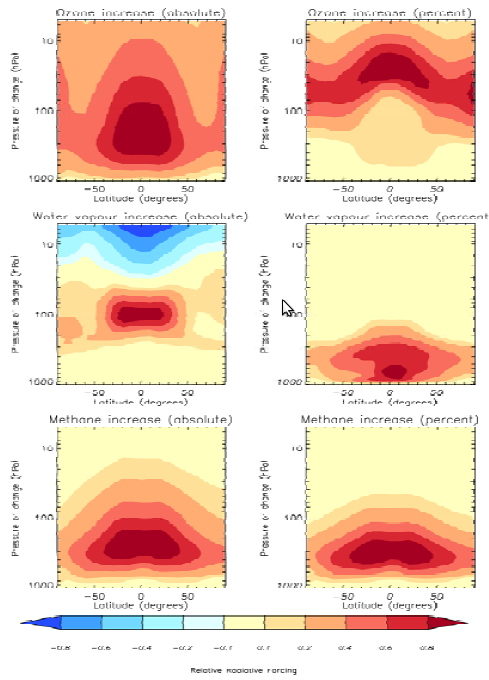
Figure 1: The plots show how surface climate depends on the altitude and latitude where ozone (top), water vapour (middle) or methane (bottom) change takes place. Shading shows the relative surface impact, measured as a radiative forcing, from either a fixed mass increase applied at different altitudes (left hand frames) or a fixed percentage increase applied at different altitudes (right hand frames). Red shows where increases to these greenhouse gases lead to maximum surface warming - this is typically in the upper troposphere/ lower stratosphere region. The Figure follows methodology outlined in Forster and Shine (1997). [Figure from ESA, 2008, courtesy of P. Forster].
In addition to the effects of greenhouse gases highlighted in Figure 1, sub-visible cirrus clouds (SVC) in the UTLS have important impacts on the global climate through their radiative effects on solar and terrestrial radiation (IPCC, 2007). In addition, the atmospheric composition can be changed through heterogeneous reactions at cloud particle surfaces. The impact and role of cirrus clouds in global climate change is under discussion and a factor of major uncertainty in climate modelling.
Processes in the UTLS region
In spite of its immense importance, the UTLS region is one of the least understood regions of the atmosphere. This is a result of its great dynamical, microphysical and chemical complexity and a lack of 3D observations with high spatial resolution. Structure and composition of the UTLS are the result of a complex interplay of various atmospheric processes that operate at different temporal and spatial scales (see Figure 2). Some of these processes are illustrated in Figure 2. Bi-directional quasi-horizontal transport and mixing in the vicinity of the subtropical jet (STJ) contributes to stratosphere-troposphere exchange. It occurs on synoptic time scales and is often associated with pronounced filamentary structures as shown in Figure 4.
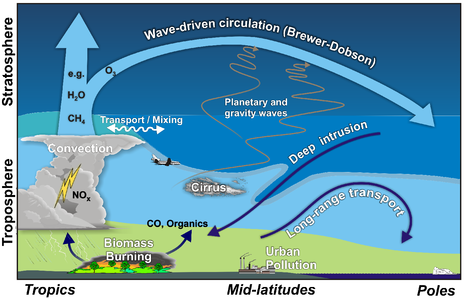
Figure 2: Global aspects of the troposphere and lower stratosphere atmospheric structure. The average position of the tropopause is shown by the thick grey line. The darkest blue is the “overworld”, where isentropes (above the 380-K isentropic surface) lie entirely in the stratosphere. The middle shaded blue is the lowermost stratosphere (LMS), where isentropic surfaces cross the tropopause and mixing along these isentropic surfaces is indicated by the double-arrow headed wavy line. The lightest blue indicates the free troposphere. The light green region represents the atmospheric boundary layer. The broad light-blue arrow indicates the direction of the wave-driven or Brewer Dobson circulation, which facilitates trace gas transport on seasonal time scales. The narrow dark blue arrows indicate stratospheric-tropospheric intrusions and long-range transport of e.g. industrial pollutants and biomass burning products.
Transport and mixing into the lowermost stratosphere (LMS)
The lowermost stratosphere (LMS, middle shaded blue region in Figure 2) represents an important region of the UTLS. A comprehensive view on transport processes determining the composition of the LMS is given in Figure 3 (Kunz, 2009). Quasi-horizontal in-mixing (“across” the subtropical jet) of air masses originating from the tropical troposphere plays a crucial role in this region of the atmosphere. Quasi-horizontal transport of tropospheric air into the LMS is triggered by disturbances of the subtropical jet by Rossby waves as illustrated in Figure 4. Exchange processes in the vicinity of the subtropical jet lead to the formation of a mixing layer, which exhibits large seasonal variability and is most pronounced in summer (Fischer et al., 2000; Hoor et al., 2004; Krebsbach et al., 2006; Brioude et al., 2008).
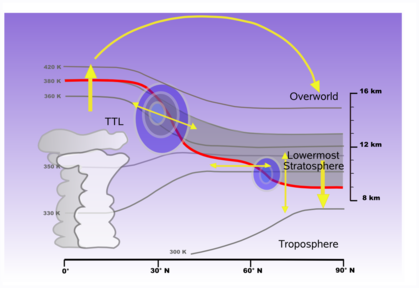
Figure 3: Processes controlling the composition of the LMS.. For analyses of transport and mixing processes, isolines of constant potential temperature (solid gray lines) are used as vertical coordinate. These isentropes can also be used to divide the lower atmosphere into overworld, middle world, and under world (see Hoskins, 1991; Holton et al., 1995). The overworld is the region of the atmosphere, where isentropes where the isentropes are entirely within the stratosphere, i. e. isentropes above 380 K. Air parcels within this region have to sink diabatically to reach the LMS and tropsophere. In contrast, isentropes in the underworld are entirely within the troposphere that means air parcels have to rise diabatically to reach the stratosphere. In the middle world is characterized by isentropes that connect the tropical troposphere with the extratropical stratosphere. The stratospheric part of the middle world, the LMS, is illustrated in Figure 3 by the grey shaded area. It is the part of the atmosphere that is confined by the tropopause (lower boundary) and 380 K isentrope (upper boundary).
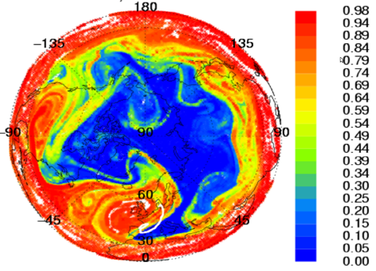
Figure 4: CLaMS simulation of mixing processes on the 350 K isentropic surface for November 10, 2002. Shown is the fraction of tropospsheric air. Note the strong disturbances of the subtropical jet (tropopause) by Rossby wave activity and the associated filamentary structures of air with large tropospheric contributions that extend into the LMS (blue area).
Transport of water vapour into the LMS and associated occurrence of sub-visible cirrus clouds
As a result of the steep negative gradient of water vapour at the transition between the upper tropical troposphere and the lowermost stratosphere, even small contributions of air originating from the troposphere can already significantly increase the water vapour background in the LMS. This has been observed by the CRISTA-2 satellite instrument in August 1997 [see Grossman et al., 2002]. The observations indicate that Rossby wave breaking (baroclinic instabilities) results in fast quasi-horizontal transport of water vapour (air with tropospheric contributions) deep into the lowermost stratosphere (up to polar latitudes). The observations also suggest that the tropospheric contribution can lead to a significant moistening of the lowermost stratosphere within a few days. In addition, sub-visible cirrus clouds have been observed up to polar latitudes in the LMS that are presumably connected to the enhanced water vapour values.
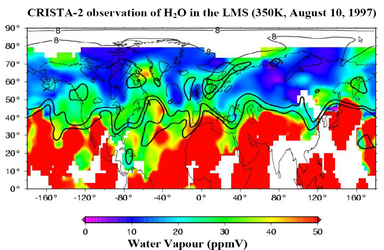
Figure 5: Transport of water vapor from the tropical troposphere into the LMS on the 350 K isentropic surface (~12 km). Shown are asynoptic water vapor values (ppmv), as observed by CRISTA-2 on August 10, 1997 during a time period of 24 hours. The location of the tropopause is indicated by 2 black solid lines (2 PVU, 4 PVU). Rossby wave breaking results in an erosion of the tropopause that can by identified by the cut-off of PVU isolines over Western Europe. Such intense wave processes frequently occur over the Atlantic ocean (e. g. Shepherd, 2003). They are obviously accompanied by fast transport of water vapor deep into the LMS.
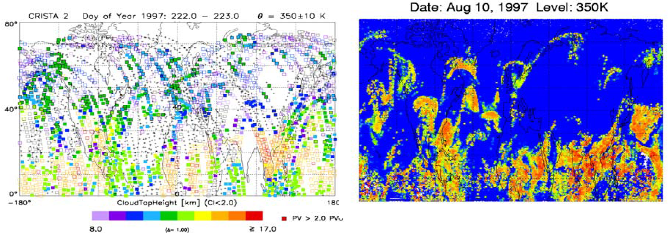
Figure 6: (Left panel) CRISTA-2 sub-visible cirrus clouds [SVC] observations that correspond to the water vapor observations shown in Figure 5. All measurement locations on August 10, 1997 are indicated by symbols. Colored symbols represent locations, where SVC where observed. The observations indicate that the occurrence of SVC in the LMS (even at polar latitudes) is in good correspondence with high water vapor values originating from quasi-horizontal transport of tropical (tropospheric) air into the LMS. The observed horizontal SVC field also resembles a simulations of the ice water content (IWC) made by the Lagrangian chemistry transport model CLaMS.
Scientific Objectives
- The CIRRUS-RS mission aims to investigate the vertical structure and composition of the LMS from the subtropical jet (STJ) to polar latitudes and the underlying processes.
- The mission will quantify the role of fast quasi-horizontal in-mixing of air originating from the tropical troposphere for the water vapour budget and cirrus cloud occurrence in the lowermost stratosphere (LMS).
- CIRRUS-RS aims to provide unique 3D observations of stratosphere-troposphere exchange structures in the vicinity of the subtropical jets.
- The mission aims to close the observational gap between synoptic-scale structures resolved by current satellite instruments and small-scale features resolved by in-situ instruments. This is essential, since mixing in the UTLS can be understood as a scale cascade from synoptic scale streamers over elongated filaments down to small-scale three-dimensional turbulence.
Observational requirements (campaign strategy)
To achieve the objectives, water vapour, cirrus clouds, temperature and the most important transport tracers such as CFCs, CO, N2O, CO2, and ozone have to be measured with high 3D spatial resolution and good spatial coverage. This is achieved by combining novel limb-observations with established in-situ techniques.
Geographical coverage: The focus of the mission is on 3-D structures of sub-visible cirrus clouds, water vapour, tracers, and temperature in the LMS (and below). The summer LMS will be profiled with a dense horizontal measurement net from the tropical side (Las Palma) of the subtropical jet towards polar latitudes (Svalbard or Kiruna). Additional flights between Oberpfaffenhofen to Greenland (Kangerlussuaq) will be made, since Rossby wave breaking events (baroclinic instabilities) in this region are most frequent and intense over the Atlantic ocean (Sheperd, 2003). An overview of the planned flight routes is given in Figure 6.
A typical flight pattern is shown in Figure 8. For an optimal use of the remote sensing instrumentation, HALO will fly at the highest possible flight level (~14 km) most of the time. Deviations from the direct flight route between Oberpfaffenhofen and the three destinations will be planned according to forecasts of active regions (e. g. tropopause fold, cirrus layers, plumes from biomass burning). For each flight, we plan at least one tomographic observation of an active region in combination with a dive in order to optimally exploit the synergies between remote-sensing and in-situ instruments.
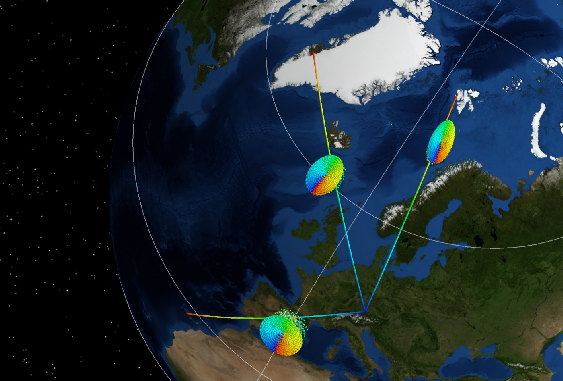
Figure 7: Geographical coverage of the CIRRUS-RS mission. Flights are planned between from Oberpfaffenhofen to Las Palmas, Kiruna (or Svalbard), Kangerlussuaq and return
Oberpfaffenhofen(OBF)
Ny Alesund(ENAS)
3438 km + 2200 km
Ny Alesund(ENAS)
Oberpfaffenhofen (OBF)
3438 km + 2200 km
Oberpfaffenhofen(OBF)
Kangerlussuaq(SFJ)
4030 km + 2200 km
Kangerlussuaq(SFJ)
Oberpfaffenhofen(OBF)
4030 km + +2200 km
Oberpfaffenhofen(OBF)
Las Palmas(TFS)
3271 km + 2* 2200 km
Las Palmas(TFS) 3271 km
Oberpfaffenhofen(OBF)
3271km + 2* 2200 km
The minimum total flight distance is about 39.000 km (incl. 8 tomographic measurements and associated dives). This corresponds to 43.5 flight hours. Considering some deviations from the direct connection between Oberpaffenhofen and the three destinations, a total number of 50 flight hours appears to be realistic- Total number of flight hours: ~50
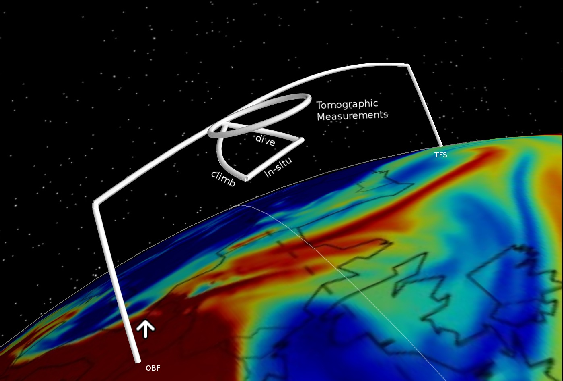
Figure 8: Typical flight pattern for CIRRUS-RS
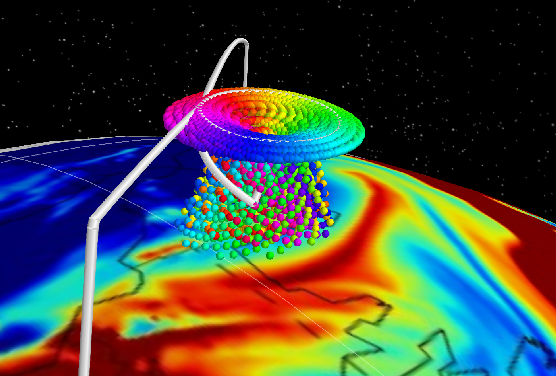
Figure 9: Typical measurement pattern for CIRRUS-RS. The synergetic use of remote sensing and in-situ measurements is an important feature of the mission. The structure of the LMS is illustrated by means of ozone fields obtained from GEMS-AQ simulations (Struzewska and Kaminski, 2008).
Some specifics of the different flight tracks are given below.
Oberpfaffenhofen to Las Palma: Extended tomographic remote-sensing observations are planned in the vicinity of the subtropical jet in order to study mixing events (e. g. tropopause folds). The encountered mixing events will also be analysed using classical tracer correlations [e. g. CO and ozone] on the basisof in-situ aircraft measurements.
Oberpfaffenhofen to Ny Alesund (Svalbard): The flight planning will focus on the occurrence of cirrus clouds resulting from moist intrusions from the tropical troposphere into the LMS. Tomographic limb-observations of the spatial structure of the cirrus clouds will be combined with in-situ observations providing information on the micro-physical characteristics of the encountered cirrus cloud fields.
Oberpfaffenhofen to Kangerlussuaq (Greenland): These flights have the same characteristics as the flights between Oberpfaffenhofen and Kiruna (Svalbard). In addition, there is a good chance to observe plumes of pollutants from northern hemisphere boreal forest fires, which represent a significant source of climatically important trace gases and aerosols to the atmosphere. Biomass burning at tropical and mid-latitudes and large-scale fires in the boreal forests of Canada emit organic compounds in significant quantities. These intense fires create pyro-convective uplift by which plumes are lofted through the mid troposphere, reaching the upper troposphere and sometimes the lower stratosphere. They can be transported over very long distances and influence ozone production (and thereby climate).
Lagrangian experiment: If meteorological conditions allows we also plan a specific Lagrangian experiment where we follow the evolution of a persistent contrail into a more extensive cirrus. An example of the advection and dispersion of a persistent contrail is described by Minis et al. (1988), see Figure 10.
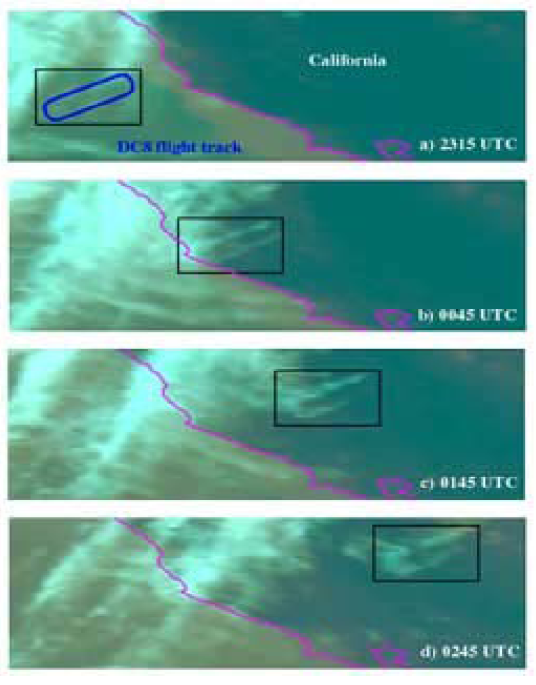
Figure 10: Time series of GOES-8 satellite images showing the evolution of a contrail from an initial oval shape to extensive cirrus clouds (from Minnis et al., 1998).
For this experiment we would fly a race track pattern with HALO during the in-situ flight section of one of the outbound flights to Ny Alesund or Kangerlussuaq and produce an initial contrail in an area with condition for the formation of persistent contrails. During the race track pattern we will release a perfluorocarbon tracer to tag the initial HALO contrail and also measure its micro-physical properties. During the return flight we will then resample this contrail after several hours and observe the evolution in terms of contrail dispersion and change in optical properties by in-situ and remote measurements
Instrumentation
The remote-sensing package consists of instruments covering a wide spectral range from the infrared to UV, thereby providing a large number of chemical species, including water vapour, ozone, transport tracers, and cloud parameters. It is complemented by a suite of in-situ-observations focussing on water vapour and cloud particles as well as transport tracers. The following remote sensing and insitu instruments are part of the CIRRUS-RS payload.
Mission planning and simulations
Forecasts and post-flight data analyses will be primarily based on the JÜLICH Chemical Lagrangian Model of the Stratosphere (ClaMS), which is the first Chemistry Transport Model (CTM) based on Lagrangian transport where the concept of a deformation-induced mixing was successfully realized both in 2 and 3 dimensions (McKenna et al. JGR, 2002, Konopka et al. JGR, 2004). CLaMS is based on a Lagrangian formulation of the tracer transport and, unlike Eulerian CTMs, considers an ensemble of air parcels on a time-dependent irregular grid that is transported by use of the 3d-trajectories. The irreversible part of transport, i.e. mixing, is controlled by the local horizontal strain and vertical shear rates with mixing parameters deduced from observations. This physically motivated parameterization of mixing that can be varied in a broad range, from a no-mixing case to an exaggerated mixing (Konopka et al., 2004; 2007). By this approach, the impact of the most uncertain components of transport (i.e. vertical velocities and mixing) on the distribution of all relevant species can also be analyzed. Global and high resolution (up to 20 km / few 100m – horizontal/vertical resolution) simulations with the most recent version of CLaMS (Konopka et al., ACP, 2007) covers both the troposphere and the stratosphere and will be utilised in the framework of this project for forecasts as well as analysis of the results.
References
Brioude, J., J.-P. Cammas, O. R. Cooper, and P. Nedelec, Characterisation of the composition, structure, and seasonal variation of the mixing layer above the extra-tropical tropopause as revealed ny MOZAIC measurements, J. Geophys. Res., 113, doi:10.1029/2007JD009184, 2008.
Grossmann, K.U., D. Offermann, O. Gusev, J. Oberheide, M. Riese, and R. Spang, The CRISTA-2 mission, J. Geophys. Res., 10.1029/2001JD000667, 2002.
ESA: Candidate Earth Explorer Core Missions – Report for Assessment: PREMIER – Process Exploitation through Measurements of Infrared and millimetre-wave Emitted Radiation, SP- 20 1313/5, ESA Publications Division, ESTEC, Keplerlaan 1, 2200 AG Noordwijk, The Netherlands,, 2008
Fischer, H., F. G. Wienhold, P. Hoor, O. Bujok, C. Schiller, P. Siegmund, M. Ambaum, H. A. Scheeren, and J. Lelieveld, Tracer correlations in the northern high latitude lowermost stratosphere: Influence of cross‐tropopause mass exchange, Geophys. Res. Lett., 27(1), 97-100, 2000.
Forster, P.M.D., K.P. Shine, Radiative forcing and temperature trends from stratospheric ozone changes, J. Geophys. Res., 102 (D9), 10841-10855, 1997.
Hoor, P., H. Bönisch, D. Brunner, A. Engel, H. Fischer, C. Gurk, G. Günther, M. Hegglin, M. Krebsbach, R. Maser, Th. Peter, C. Schiller, U. Schmidt, N. Spelten, H. Wernli and V. Wirth: New insights into upward transport across the extratropical tropopause derived from extensive in situ measurements during the SPURT project. SPARC Newsletter 22, 29-31, 2004.
Hoskins, B. J., Towards a PV – Theta view of the general circulation, Tellus, 43 B, 27-35, 1991.
Holton, J. R., P. H. Haynes, M. E, McIntyre, A. R. Douglass, R. B. Rood, and L. Pfister, Stratosphere-troposphere exchange, Rev. Geophys., 33, 403-440, 1995.
Konopka, P., H.-M. Steinhorst, J.-U. Grooss, G. Günther, R. Müller, J. Elkins, H.-J. Jost, E. Richard, U. Schmidt, G. Toon, D. McKenna, Mixing and Ozone Loss in the 1999-2000 Arctic Vortex: Simulations with the 3-dimensional Chemical Lagrangian Model of the Stratosphere (CLaMS), J. Geophys. Res., 109, D2, 10.1029/2003JD003792, 2004.
Konopka, P., G. Günther, R. Müller, F. H. Santos, C. Schiller, A. Ulanovsky, H. Schlager, C. M. Volk, S. Viciani, L. Pan, D. S. McKenna, M. Riese, Contribution of mixing to upward transport across the tropical tropopause layer (TTL), Atmos. Chem. Phys., 7, 3285-3308, 2007.
Kunz, A., Observation- and model.based study of the extra-tropical UTLS, PhD thesis, University of Wuppertal, Germany, 2009
Krebsbach, M., C. Schiller, D. Brunner, G. Günther, M. I. Hegglin, D. Mottaghy, M. Riese, N. Spelten, H. Wernli, Seasonal cycles and variability of O3 and H2O in the UT/LMS during SPURT, Atmos. Chem. Phys., 6, 109-125, 2006.
McKenna, D. S., Konopka, P, Grooss, J.-U., Günther, Müller, R., Spang, R., Offermann, D., Orsolini, Y., A new Chemical Lagrangian Model of the Stratosphere (ClaMS): Part I Formulation of Advection and Mixing, J. Geophys. Res.,Vol. 107, NO. D16,10.1029/2000JD000114 , 2002.
Minnis, P., D.F. Young, D.P. Garber, L. Nguyen, W.L. Smith, Jr., and R. Palikonda: Transformation of contrails into cirrus during SUCCESS. Geophys. Res. Lett., 25, 11571160, 1998.
Shepherd, T., Large-scale atmospheric dynamics for chemists, Chem. Rev., 103, 4509-4531, 2003.
Struzewska, J. and Kaminski, J. W., Formation and transport of photooxidants over Europe during the July 2006 heat wave – observations and GEM-AQ model simulations, Atmos. Chem. Phys.., 8, 3, 721--736, 2008.